
A short tour of the NIR analysis landscape
Feed manufacturers can be excused for being a little daunted when navigating through the developing world of NIR analysis. On the one hand NIR is becoming easier and more powerful, while on the other, the choice of analysis options is growing rapidly.
By Richard Mills, FOSS,Denmark
The use of NIR analysis for feed started in earnest in the late 1980s, allowing a quick assessment of essential measurement parameters such as protein and moisture. While the advantages quickly became apparent to feed manufacturers who wanted analysis results in minutes rather than days as with the reference chemical analysis methods, some niggling technical problems remained to plague the NIR scientific community and equipment makers alike.
Challenges and gains
Challenges included the need to handle the broad variety of sample types involved in feed analysis from fresh forage to powders and pellets. Then there were the calibrations to think about and the constant calibration updates across multiple instruments, instrument stability and so on. The gauntlet has been taken up by scientists and developers from academia and commercial corporations who, over time, have formed a virtual research and development team around the globe, witnessed by conferences such as the NIR2013 event held in Montpellier last year. With this weight of constant development, NIR analysis technology has achieved a level of consolidation and performance that makes its use more obvious than ever before. The gains have been made in both of the main technology areas namely, reflectance, where light is reflected off a sample and transmission, where light is passed through a sample. The improvements encompass instrument stability, sample presentation, software and usability and internet networking. The advent of in-line solutions for production control is broadening the horizon further for feed manufacturers.
Main NIR technology areas
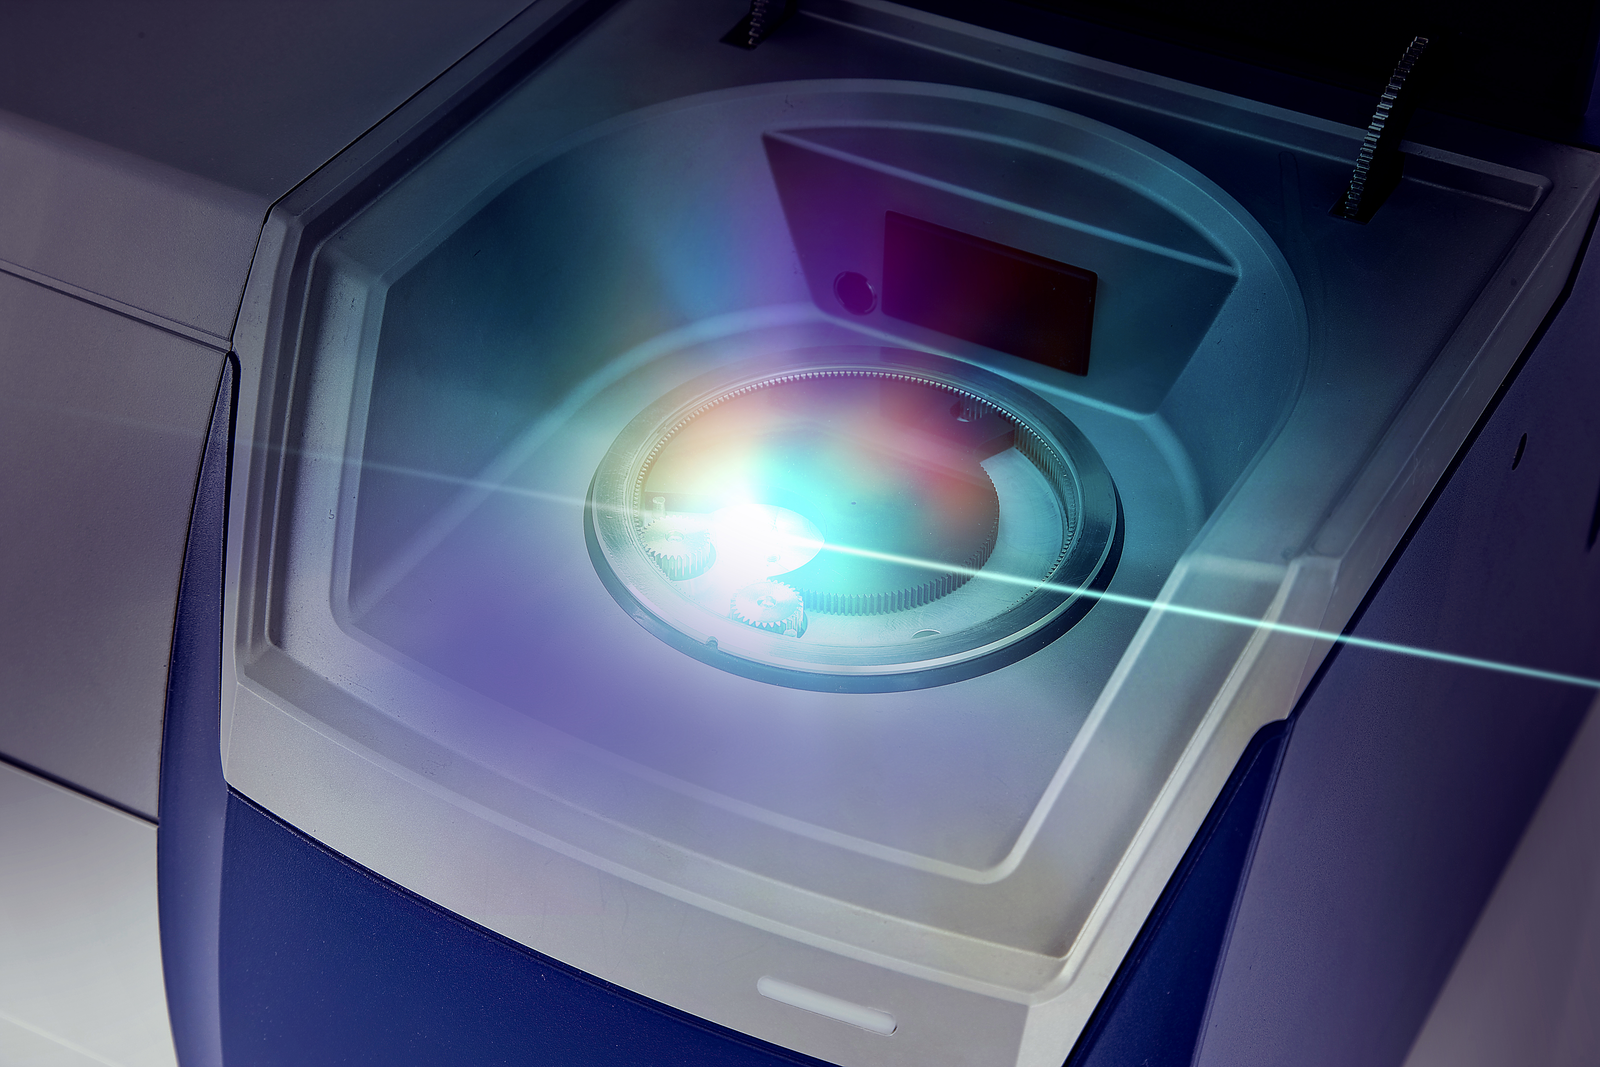
A natural place to start a discussion about NIR technology areas is at the heart of any NIR instrument with the spectrometer that converts the infrared light into a usable signal. A common consideration across all spectrometer technologies is the wavelength range measured in nanometers (nanometers nm or reciprocal centimetres cm-1). Without getting too deep into a technical discussion it can be said that certain wavelengths are better for measuring certain samples and parameters than others. The wavelength required to measure protein in grain for example is different from that required to measure amino acids in feed ingredients and so on. Another consideration is the signal to noise ratio offered by different instruments at certain wavelengths as this indicates the quality of the signal generated. For quantitative measurements of feed, a so called scanning grating monochromator instrument is a proven choice. It is ideal for quantitative measurements across a broad spectrum of applications with a broad wavelength range for a wide range of parameters including those such as colour in fish food or similar requiring the visible region in addition to the NIR region. Alternatively, when using NIR transmission for measuring inhomogeneous samples such as grain, it is an advantage to use the Short Wave NIR range (850 – 1050nm) where the light penetration is good and the premium signal to noise ratio offered by a scanning grating monochromator is essential. On the minus side, an internal wavelength standard is required to achieve good wavelength accuracy. However, like all other aspects of NIR technology, scanning grating instruments are constantly evolving and many are using this internal wavelength standard to demonstrate good wavelength accuracy.
FT-NIR technology
For qualitative measurements in the laboratory where narrow instrument bandwidth is needed, FT-NIR technology has advantages. It is ideal for pin-point qualitative measurements of substances with narrow absorption bands or for some quantitative measurement applications for samples having closely spaced narrow absorption bands. Plus, it is possible to adjust the resolution to obtain the best trade-off between wavelength resolution and the signal to noise ratio. Disadvantages include a lower signal/noise ratio than a monochromator instrument, particularly at short wavelengths and the omitted visible wavelength range (below 850 nm). FT NIR is also a vibration-sensitive technology and the design must take this into account for applications in a production environment. On the subject of production, the use of NIR analysis instruments close to the production line or even for continuous measurements of material in the production line is increasingly widespread. For these measurements, fixed grating Detector Diode Array (DDA) is the best option. It is ideal for robust and vibration-tolerant instruments and the simultaneous measurement of the full spectrum also makes it tolerant to sample movement. On the downside, a trade-off between wavelength range, resolution and signal to noise ratio must be made.
Beyond the box
We should not forget that a lot of progress has also been made ‘outside the box’ in aspects such as, sample presentation, intuitive software interfaces and an ever-growing choice of calibrations based on different mathematical principles. As anyone attending the above-mentioned NIR2013 event will confirm, calibration is a vast subject in itself. Of note are Partial Least Squares (PLS) calibrations which are particularly strong where the parameter being measured has a linear relationship to the infrared spectra. And, in recent years Artificial Neural Network (ANN) calibrations have become increasingly popular for their ability to accommodate a wide selection of sample types based on a large pool of reference data. Handling all these calibrations can be a challenge, especially when regular updates are required to incorporate new sample data, for example, for a new harvest season. For NIR users with a number of instruments at different locations, updating them all can involve a lot of leg work going from one unit to another and with the constant risk of human error. Thankfully, advances in networking software allows updates to be done all in one go to multiple instruments and with no chance of someone forgetting to copy a file or similar.
In-line analysis
Another trend is the use of in-line analysis with NIR directly in the process stream. Already an established concept in the dairy industry, the use of in-line analysis in feed is difficult due to the varying nature of raw materials, the non-continuous production (batch to batch) and the corresponding need to make complex feed formulations on the fly. But with more powerful computer and software systems becoming available, the complex feed formulation aspect of feed process control is now becoming a reality. This allows a retrospective view of the NIR measurements, for example, protein from main ingredients going into the feed mix which then allows a calculation of required adjustments to move feed production closer to target values. The use of in-line NIR has, to date, been mainly in South America by pig and poultry integrators for production of a restricted number of feed formulations.

The use of NIR analysis for feed started in earnest in the late nineteen eighties, allowing a quick assessment of essential measurement parameters such as protein and moisture.
New areas
As this short tour through the NIR landscape indicates, there will be plenty of new areas for the feed and scientific community to explore in time for conferences such as the NIR2015 in Brazil and the NIR2017 event to be held in Copenhagen, Denmark. But while the research and development continues, there is already plenty of existing and increasingly well-proven NIR technology available to help boost feed output.
Article featured in AllAboutFeed 22.3
Join 26,000+ subscribers
Subscribe to our newsletter to stay updated about all the need-to-know content in the feed sector, three times a week.


 Beheer
 WP Admin
  Bewerk bericht