
Making stable and robust calibrations in NIR analysis
Calibrations in NIR are all dependent on the number of samples tested. Variation can differ by the methodologies used, but the main proverb is simplicity. Also, some specific approaches to protecting against known interference are discussed.
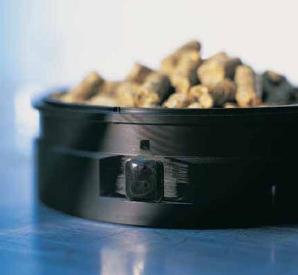
| The single most important step in making any NIR calibration is the selection of training samples(Photo: FOSS) |
The single most important step in making any NIR calibration is the selection of training samples. Whatever algorithm is used to construct the prediction rule, it will learn this rule from the training samples. If the rule is subsequently used with samples of a type not represented in the training set, the performance may be unsatisfactory. Thus the ideal calibration set, as well as having a good range of the property of interest, represents all the important sources of variability that will be seen in the samples to be predicted in the future.
The difficulty here is identifying what is important. Some factors, notably particle size and moisture content, are relevant to many applications. Others will be application-specific and may require more thought. In general, the best protection against accidentally omitting some important source of variability is to have as large and varied a training set as possible.
Choosing and using a calibration method
The standard approaches of principal components regression (PCR) and partial least squares regression (PLSR) both work well for the majority of routine NIR applications, and my view is that there is little to choose between them. The linear prediction equations used in these standard approaches may not be flexible enough when the range of the property to be predicted is very large, for example, compositions in the range 0-40%, or when the training set is very heterogeneous, for example, animal feeds with very different compositions and physical forms.
Then the use of either local methods, which fit linear equations over restricted ranges, or non-linear approaches such as artificial neural networks (ANN) or support vector machines (SVM) may lead to improved predictions.
Whatever algorithm is used, the key to producing a stable and robust calibration is to avoid overfitting, by using either a test set or some form of cross-validation to moderate the fitting process. The more sophisticated the algorithm, the more crucial it becomes to stop it adapting too closely to the samples it is trained on and hence degrading its ability to generalise. The safest policy is to use the simplest method you can, and within that the simplest model you can, avoiding the temptation to add a lot of extra complexity for a small gain in performance.
Robust to external sources of variability
In addition to the natural variability between samples, calibrations can also be affected by factors such as variations in sample temperature and differences between the instruments used to make the spectral measurements. One approach to making calibrations robust to this sort of external variability is simply to include the variability in the training set, for example, to include samples at different temperatures or samples measured on different instruments. However, when we can deliberately manipulate the interfering factors and hence determine their effects experimentally, other approaches become possible. Suppose the interfering factor is temperature. Then the necessary experiment consists of measuring the spectra of a small number of samples each at a small number of temperatures. Separately for each sample, we create a set of difference spectra by subtracting either one of the spectra or the mean spectrum for that sample from all the rest. Then we pool these difference spectra over samples, to give us a set of spectra that capture the spectral variability caused when temperature changes.
Now there are two options. The repeatability file approach essentially adds these spectra to the training set with reference values of zero. This tells the calibration algorithm that spectral variability of this type should not change the predictions, and will have an effect similar to the more obvious approach of including samples at different temperatures in the training set. The main advantage of doing it this way is that it is easy, within this framework, to give the difference spectra extra weight in the calibration. This, and the precise information provided by the experiment, means that the job can be done with a relatively small number of extra measurements.
3D spectra interpretation
An alternative, more recent suggestion is to use the difference spectra to identify directions in spectral space in which most of the variability due to temperature lies, and apply a pre-treatment to the training set spectra that removes these directions. This is shown geometrically in Figure 1. Each point in the picture represents a spectrum measured at three wavelengths (not very many, but this allows us to draw a picture) and plotted in a three-dimensional space with one axis corresponding to the absorbance at each wavelength. The blue points are the training samples. The purple points are the difference spectra from the experiment in which the interfering factor was varied. The purple line is the direction of the first principal component from a principal components analysis (PCA) of these difference spectra.
Nearly all of the spectral variability due to the interfering factor lies in this direction. This principal component is used to define the yellow plane, which is orthogonal (at right angles) to it, and then the training set spectra are projected onto the plane to give the red points, the points in the plane nearest to the blue points representing the spectra. To make the calibration we use the projected spectra, i.e. the red points, instead of the raw spectra, i.e. the blue points. Since these spectra have no variability in the direction most affected by the interfering factor, the resulting calibration will be insensitive to the factor.
The calculations required to do all this are relatively simple: a PCA of the difference spectra, and an orthogonal projection of the training spectra, which is a straightforward matrix multiplication. The attraction of this approach is that it is likely to lead to simpler and more interpretable models because it subtracts interfering variability rather than adding it.
If we were to include the purple points in the training set but give them reference values of zero, a calibration method like PLS that constructs factors would inevitably include in its factor space the interfering variability, i.e. the purple direction. This direction would get little weight in the prediction equation, because of the zero reference values, but it seems more logical to exclude the direction in the first place, rather than emphasise it, model it in the factor space, and then try to suppress it.
There are, of course, limits to what any method can achieve. If all the spectral variability due to the parameter we are trying to calibrate for lies in exactly the same dimensions as the spectral variability due to the interfering factor then eliminating or downweighting these dimensions will destroy or badly degrade the calibration.
Fortunately, one of the great strengths of NIR as a measurement tool is that information is typically repeated in different parts of the spectrum, so that a complete overlap of variability from any two distinct sources is rare, and approaches like the ones described can be used in many situations to improve robustness without degrading accuracy.
This article was adapted from FOSS’ In Focus, Vol. 32, No 2, 2008


 Beheer
 WP Admin
  Bewerk bericht