India’s edible oil industry in a global perspective
India has gained importance in the world over the last few years by virtue of becoming the world’s number one importer of edible oils and an exporter of protein meals. The relatively cheaper logistics cost of supplying vegetable protein to the importing countries in the Asian area has given India an edge over other exporting countries like from South America. Also its non-GMO protein has been able to attract a premium
Today, China and India are the two countries that the world is scrutinising with very keen interest. This is particularly so on the agricultural front as both countries are big importers of edible oils. China is also the biggest importer of seeds and grains. India, however, still exports protein despite a huge protein deficiency in the diets of the 40% of the population that live below the poverty line.
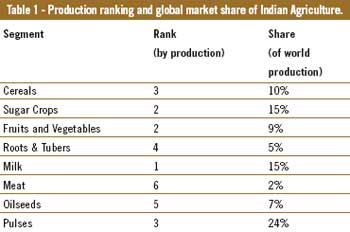
India is one of the top three producers in most of the world’s major agricultural commodities. It is number one in milk with 15% of the market share, third in the production of pulses with 24% share, and fifth in the production of oilseeds with 7% share (Table 1). India consumes about US$ 200 billion worth of food per year. The country is self sufficient in food grain needs and is able to feed its over one billion inhabitants. India is currently producing about 240 million tonnes of food grains, and this shall grow by at least 25% by 2020.
India has the highest percentage of arable land – 57% versus 16% average in the rest of the world. Unfortunately, however, the productivity is very low. Indian farmers and the administration are both seriously perturbed by this matter and are taking measures to amend the situation. Agriculture administrators toured Argentina to study soybean cultivation and farm practices, so that the productivity of the Indian soya crop could be increased from its present dismal state.
Too small infrastructure
The issues facing Indian agriculture are very small and marginal land holdings, low penetration of technology, dependence on monsoon rains for almost 58% of the arable land, and non-availability of hybrid/certified seed.
The supply chain is also very fragmented in so far as not facilitating farm produce to reach the market. As a result, a farmer is able to realise only 30-35% of the final price paid by the consumer, whereas elsewhere in the world the farmer realises 60-65%. This acts as a substantial deterrent for farmers to invest in farm inputs. The credit infrastructure of the rural farm sector is still inadequate thereby forcing the farmers to decrease sale prices and borrow cash at prohibitive interest rates to meet their basic needs. Cumulatively, all these factors have a negative impact on agricultural production.
There is change
Thanks to favourable monsoon rains, the growth in agricultural GDP has been positive for the last consecutive five years. In 2003 it was at its highest at 10%. The average growth has been between 4 to 6% in all subsequent years. The government has been very liberal in increasing the Minimum Support Prices (MSP) of agricultural commodities as an incentive to boost farm incomes. The continuous increase in prices of agricultural commodities the world over has enabled Indian farmers to realise better prices for their produce. Also, India is now very closely connected to the world of commodity prices. Institutional credit to agriculture has also increased consistently and seen a sharp jump over the past few years. Thus, additional income in the hands of farmers has given them the much-needed incentive to invest in better seeds, fertiliser inputs and technology. Between 2003-2007, fertiliser consumption grew by 20%, and tractor sales went up by 19%.
Feed industry data incomplete
Due to incomplete data on feed production in India, this aspect cannot be realistically analysed. During the previous decade, production of total compound feed by members of Compound Livestock Feed Manufacturer’s Association (CLFMA) increased from 2.79 million tonnes (2001-02) to 3.77 million tonnes (2008-09). The production of compound poultry feed has shown an increase over the years, but a slight decline is observed in cattle feed production since 2005-2006.
Total feed consumption in India is estimated at 21.4 mt in the organised sector, comprising 7 mt broiler feed, 8.5 mt layer feed, 5.5 mt dairy feed, 0.25 mt shrimp feed, 0.1 mt fish feed, and 0.05 mt for other species.
There is a clear trend of downward integration in the poultry industry by creating captive solvent extraction and feed production facilities to reduce dependence on others and therefore economising costs.
Processing industry
Indian consumers have traditionally used plenty of oil and fat (of both butter and vegetable origin) in their differing varieties of food and desserts. The consumption level increases during the festival and marriage seasons. The per capita consumption has increased from 7.4 kg around 10 years ago to the current figure of 12.2 kg (2009-2010). This may look much lower when compared to the world average of 20 kg, but a large segment of the Indian population cannot afford costly edible oils.
New capacities of solvent extraction plants and refining created since the 1990s were in the range of 500 tonnes per day for crush and 250 tonnes per day for refining. At the close of 20th century, two new developments took place – entry of low cost palm oil in the world’s oil basket, and Wilmar joining with Indian company Adani to build a state of the art refinery of 1,000 tonnes per day capacity with a fractionation unit for palm oil. This immediately caught the eyes of others and a series of new refineries of this size were developed. These refineries produced quality products which brought a sea of change in their market perception, resulting in production at a relatively much lower processing cost. This expansion is ongoing as the import of oil continues to increase to meet the ever-increasing demand of Indian consumers.As of now, the capacity of both solvent extraction and refining is hardly utilised in full, and is currently up to 33% of installed capacity.
Edible oil scene
The Indian edible oil sector has many typical characteristics distinctly different from other countries – especially those in the western hemisphere. The oil basket available to the consumers has many varieties – major domestic oils are: groundnut, mustard/rapeseed, cottonseed, soybean and sunflower. Minor domestic oils are: ricebran, mahua (Madhuca longifolia), sesame, safflower and coconut. Imported oils are mainly palm, soybean and sunflower. About 60-70% of groundnut and mustard oil, and almost 100% of coconut oil is consumed in crude form without refining because of their distinct flavours and aroma. All other oils are marketed only after refining. Market shares of raw oil, refined oil and Vanaspati (partially hydrogenated vegetable oil) are respectively 42%, 43% and 13%.The government has frozen the tariff value on import of oils and the present rate of duty is nil on crude oils and 7.5% on refined oils. This policy has remained unchanged since 2008. Thus, the Indian market is being flooded by imported oil – mainly palm, soybean and sunflower. The South American industries for soybean oil and Malaysia/Indonesia for palm oil have discovered India as a dumping ground for their produce. India still has an insatiable appetite for edible oil as the income levels rise.
Over the past decade, world class edible oil refineries have been set up in India where superior quality refined oil is produced at a low processing cost. The days of small sized batch refineries of 50 t per day capacities are over. However, the capacity utilisation of Indian refineries is still at a meagre 35% of installed capacity. Refined soybean oil is actively traded on futures exchanges and accounts for their biggest turnovers. Thus, the Indian edible oil situation is going to persistently influence the world demand and supply to a large extent.
World’s versus Indian oilseeds
The conventional basket of major oilseeds comprises of soybean (57%), cottonseed (12%), rapeseed (12%), groundnut (8%), palm kernel (3%), sunflower seed (7%) and copra (1%). These figures are for 2007-08. The share of soybean production in the world’s total oilseed production has varied between 55 and 60% – the highest being 59.4% in 2002-03, and the lowest being 55.6% in 2003-04.
The growth of soybean in terms of area, yield and production for major producers of the world and that for India is shown in Table 2. It is interesting to note the spectacular percentage growth in soya area as well as production in Argentina/Brazil, and even in India. The percentage yield increases have been the highest in USA and India, but in absolute terms, India has a very poor yield per hectare. India’s share in world soybean production has been 3.8% in 2009-10 (Table 3).All major producers of soybean have surplus soybean, oil and meal for export. However, India exports soybean meal and imports soybean oil. India’s share in the world’s soybean meal export was 8% in 2008-09, which declined to 3.8% in 2009-10, due to its uncompetitive pricing in relation to suppliers, and also the aggressive marketing by the USA in the backdrop of bumper crop harvested by them (Table 4).China has been the world’s biggest importer of soybean with 55.3% share in 2009-10. China, it can be stated, has become the country which dictates and decides the pace and fate of world trade in soybean and its products, because of its insatiable appetite for soybean seed, oils and other agro-commodities. Europe imported 41.7% (2009-10) of world’s soybean meal export. Other major soya meal importing countries are Vietnam (4.9%), Indonesia (4.7%) and Thailand (4.1%).
Annual SBM export ranged from a low 2.11 mt (2009-10) to a high of 4.18 mt (2008-09). Annual total meal export ranged from a low of 3.22 mt (2009-10) to a high of 5.44 mt (2007-08). The domestic consumption of SBM in India has also risen with the following features:
• Average consumption has doubled in the last 5 years, together with an increase in the soya crop size, thus leaving the surplus disposable meal available for export.
• The year 2009-10 has been a typical one in terms of substantial decrease in meal export numbers because of lower crush as a result of continuous disparities in the crush right from the start of the season. USA’s bumper crop has taken away this traditional share of Indian soya meal.
• The poultry industry has been seeing an annual growth rate of 15% for broilers and 10% for layers due to changing eating habits of younger people and also general growth in the disposable income of families.
Current Indian soybean crop
The harvest of the Indian soya crop was completed by mid-October 2010. The area sown in 2010 was less than that of 2009 but the tremendous and timely rains helped in satisfactory growth of the crop. SOPA (Soybean Processors of India) have estimated the 2010 crop at 10.1 mt versus 9.7 mt in 2009. The carry in from 2009 is estimated at 1 mt. Thus, ample soybean was likely to remain available to the industry for crush in 2010. The exportable surplus of soya meal even after meeting the rising domestic demand for food and feed grade meal, estimated at 3.5 mt for 2010-11, will be not less than 4.5 mt.
Indian processors learnt a bitter lesson in 2009 by losing their export market share of soya meal by offering uncompetitive prices in relation to the world’s soya meal exporters. 2010 is likely to be different as they are keen to offer quality meal at competitive prices to the world. The present export order book of more than 1 mt for the new crop soya meal is a clear indicator of this direction.
This article was subtracted from a presentation by Dr Davish Jain at the 2010 Soya & Oilseed Summit/Global Soybean & Grain Transport held in Minneapolis, Minnesota, USA on 4-5 October, 2010.
Join 26,000+ subscribers
Subscribe to our newsletter to stay updated about all the need-to-know content in the feed sector, three times a week.