Biomin has carried out extensive work collecting information on the occurrence of mycotoxins by starting a special mycotoxin survey program in the year 2005. This report provides an insight on the distribution of mycotoxins as well as their levels of occurrence in certain feedstuffs/feeds of different regions from January to December 2011.
For the mycotoxin survey, 4,327 samples were sourced between January 2011 and December 2011 from different countries worldwide. In total, 13,854 analyses were carried out to investigate the occurrence of aflatoxins (Afla), zearalenone (ZON), deoxynivalenol (DON), fumonisins (FUM) and/or ochratoxin A (OTA) in the different regions and feed materials. These samples were classified firstly according to their region of origin, mainly by the Asia-Pacific (37%), Europe (35%), the Americas (27%), and secondly by means of commodity types. Samples tested ranged from raw materials like corn (33%), wheat (9%), barley (7%) and soybean (5%) to finished feed (25%), silage (8%) and other feed ingredients (13%).
As the samples were collected on a worldwide basis, analytical procedures were carried out in local analysis labs. However, the majority of the analyses were performed at Romer Labs Diagnostic (Austria), Romer Labs Singapore, Romer Labs Inc (USA) and Samitec (Brazil). More than 70% of the samples were analysed by High Performance Liquid Chromatography (HPLC); followed by Enzyme Linked Immunosorbent Assay (ELISA) and the thin-layer chromatography (TLC) method. For the purpose of data analysis, non-detection levels are based on the quantification limits of the test method for each mycotoxin. For more details regarding the analytical procedure you can contact the author (karin.naehrer@biomin.net).
Overall results As can be seen in Figure 1, from all survey samples 27%, 40%, 59%, 51% and 27% tested positive for contamination with Afla, ZON, DON, FUM and OTA, respectively. It was noted that whereas the percentage of mycotoxin distribution found at the maximum levels remains similar to last year’s for ZON, DON and FUM, there was a minor decrease in the average contamination levels of all samples tested (see Table 1; average contamination year 2010 for ZON 108 ppb, DON 722 ppb and FUM 1012 ppb). In the case of Afla and OTA, the mean levels were slightly higher in comparison with 2010’s data.
Results by geographic region
The survey included more than 4,000 samples submitted by different sub-regions and the results are presented in Tables 2 (a-l). It should be mentioned that the current global trade in cereals and grains may lead to misinterpretation regarding toxin formation and mycotoxin occurrence in a certain geographic region. However, data shown in the report give an insight into the situation as observed in the field.
In North Asia, the most prevalent mycotoxins are the ones produced by Fusarium fungi, namely ZON (83%), DON (63%) and FUM (51%) with an average of 164 ppb, 782 ppb and 1,068 ppb, respectively. Similar to the previous years, aflatoxin was the most prevalent mycotoxin in South-East Asia but the incidence increased to
71% and also the average contamination level was higher with 42 ppb (2010: 65%, average 22 ppb). ZON, DON and FUM were present in 37%, 34% and 55% of the tested samples, respectively. Afla, FUM and OTA were the most prevalent in countries such as India, Pakistan and Bangladesh where 88%, 56% and 49% of analysed samples tested positive for these mycotoxins, respectively. In Oceania, presence and contamination levels especially in the case of field mycotoxins ZON and DON, drastically increased in 2011 with 26% and 49% being above the limits of detection. The mean contamination levels which were usually not higher than 100 ppb for ZON and 200 ppb for DON rose to 270 ppb and 1,354 ppb for ZON and DON, respectively. Moreover, worldwide maximum mycotoxins levels for ZON and DON were also registered in Australia this year.
In North America, half of the analysed samples were found to be positive for DON (average contamination: 459 ppb). With 76% positive samples, FUM presented again the most frequently occurring mycotoxin in Southern America with an average contamination of 1,501 ppb lower than last year (2,515 ppb). Northern Europe samples were this year only analysed for ZON and DON showing 71% positive and an average of 885 ppb for the latter (ZON: detected in 25% of the samples, average contamination 29 ppb).
Fusarium mycotoxins are of great concern in Central Europe as 41%, 64% and 51% of all samples tested were positive for ZON, DON and FUM. Afla, FUM and OTA occurrences were higher in Southern Europe with 33%, 56% and 41% positive tests, respectively (Central Europe: 19%, 51% and 20% for Afla, FUM and OTA, respectively). For the first time, Eastern Europe represented a separated sample group in this mycotoxin survey. As it can be seen from Table 2j, this group represented a mixture of all mycotoxins investigated and 65% of all samples showed the presence of more than one mycotoxin. In the Middle East, FUM was the most prevalent mycotoxin (67% positive samples), followed by OTA (50%) and Afla (37%).
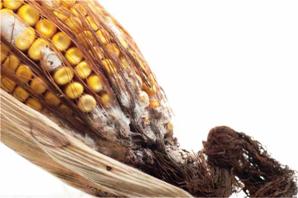
Commodities With regards to commodities, corn was again the most investigated one as was in last year’s surveys. DON and FUM were found to be the most prevalent mycotoxins with 64% and 71% of samples above the limit of quantification (year 2010: 72% and 75% samples tested positive with 956 ppb and 1912 ppb average levels for DON and FUM, respectively).
The second largest commodity group in this survey comprised finished feed with more than 1,000 samples analysed for the occurrence of mycotoxins. Whereas Fusarium toxins represented the major problem in the case of corn, feed samples cover a complex mixture of more or less all important mycotoxins from the agricultural point of view, with only 10% below the limits of the analysing method and more than 65% with at least two different mycotoxins. For finished feed samples, 42%, 58%, 64%, 64% and 40% tested positive for contamination with Afla, ZON, DON, FUM and OTA, respectively.
Following last year’s trend, ingredients such as soybean and soybean meal, rice, rice bran and barley showed in general a lower presence of mycotoxins. In wheat and wheat bran, 57% of all samples were above the quantification limits in the case of DON, with an average level of 1,254 ppb. Fusarium toxins like ZON (30%), DON (61%) and FUM (26%) represented the major contaminants in silage samples.
Conclusions The results of this mycotoxin monitoring program 2011 with more than 4,300 samples show clearly that agriculturally harmful mycotoxins are ubiquitous and present at different risk levels worldwide. Considering the fact that 41% of the tested samples were positive for more than one mycotoxin (Figure 2), there is a need to create an awareness of the possible interactions classified as additive or synergistic effects caused by multi-mycotoxins in feed. An effective mycotoxin risk management program is crucial to avoid increased management costs and economical losses due to mycotoxins in animal husbandry.
Join 26,000+ subscribers
Subscribe to our newsletter to stay updated about all the need-to-know content in the feed sector, three times a week.