
New data shows mycotoxins are not under control
In Europe and North America, contamination levels of all main mycotoxins saw an increase in Q2, compared to Q1 of this year.
This is according to the latest data from Biomin over the 2nd quarter of 2018.
Contamination levels increase
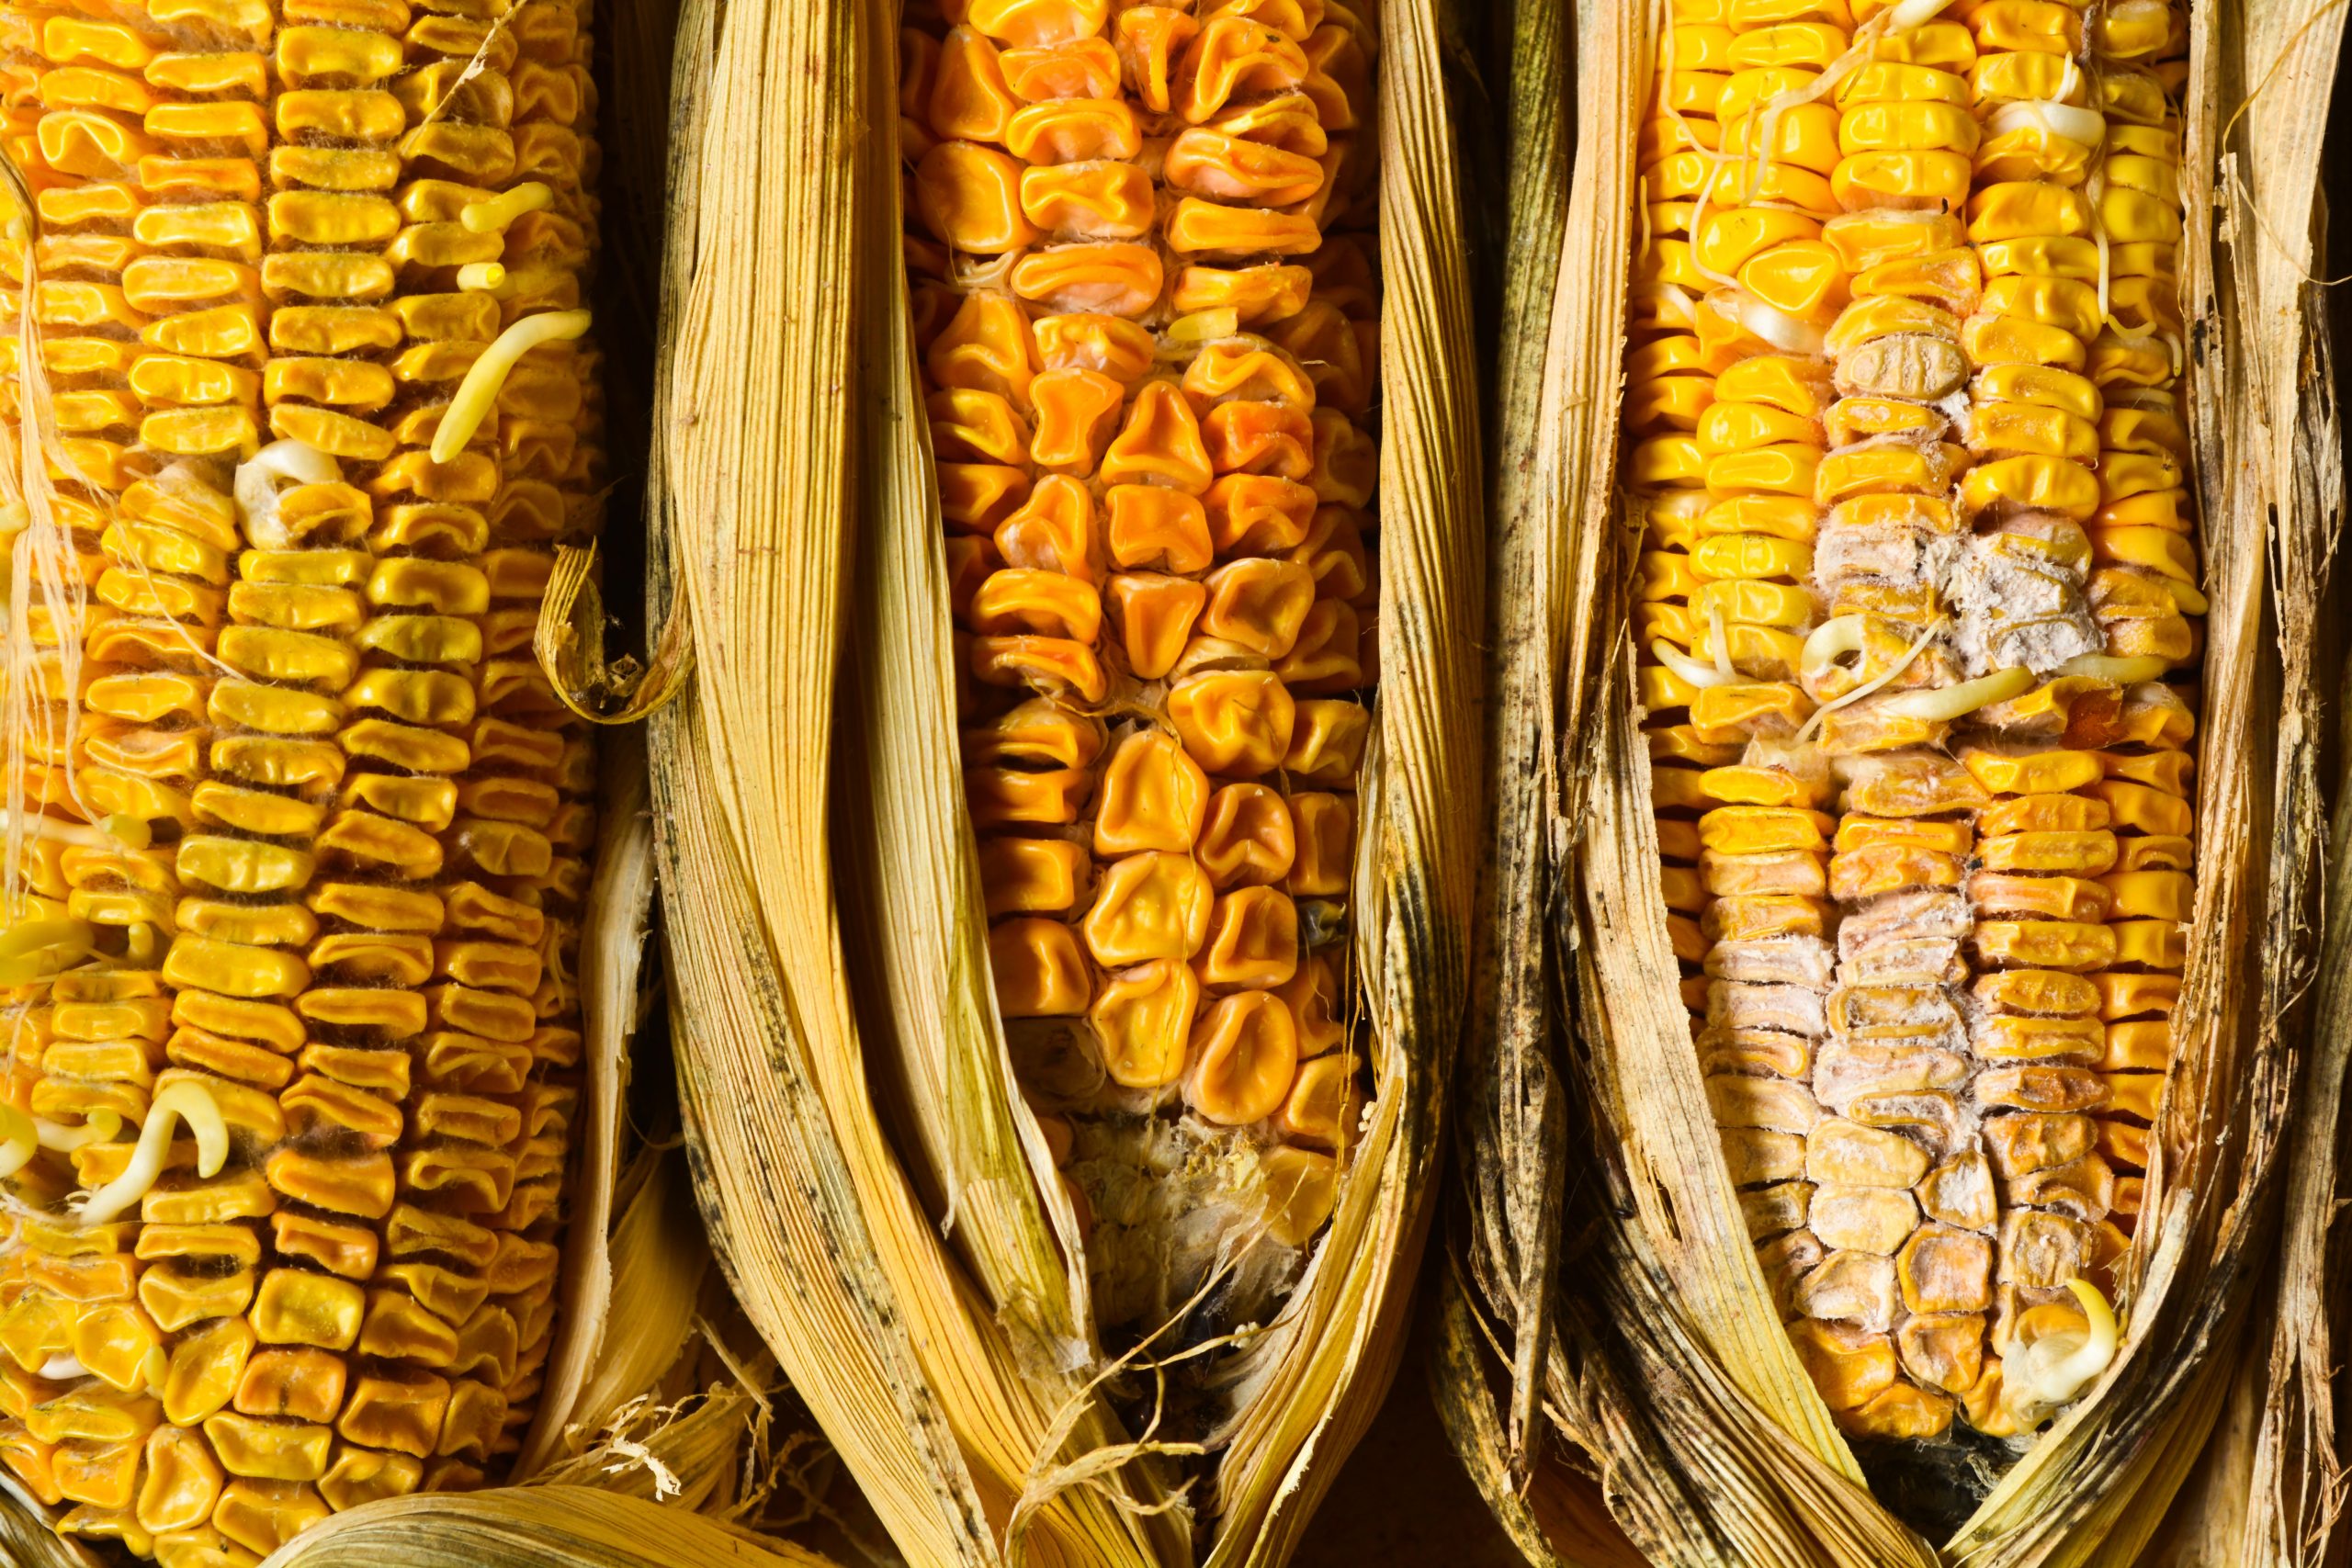
Mycotoxins that contaminate crops and animal feed have been recognised as a risk to farm animals, and account for considerable economic costs to the feed and food industries. The latest data show that in some regions of the world increases in the contamination level have been seen in the last 3 months. In Asia for example, contamination levels increased for Deoxynivalenol (DON), Zearalenones (ZEN) and Fumonisins (FUM). For Europe and North America, increases have been seen in all the analysed mycotoxins: DON, ZEN, FUM and Aflatoxins (AFLA), T2 and ochratoxins (OTA).
Changes in risk levels
Biomin addresses that higher atmospheric temperatures, elevated carbon dioxide levels and water stress associated with climate change may all contribute to higher mycotoxin contamination of crops in the future. Historical data already provides examples in which mycotoxin occurrence patterns have shifted. In Asia the risk levels between 2013 and 2015 was considered severe. This has been increased to ‘extreme’ in 2016 and 2017. In Europe the risk level has been set on ‘severe’ over the last 5 years. In 2017, North America was set on ‘extreme’ for the first time since 2013. Central America has been placed in the ‘extreme’ risk level box for already 5 years.
The risk levels are added to the regions and sub-regions to highlight the changes in contaminant levels and to point out to traders, nutritionist and farmers to be extra aware. The risk level (E = extreme, S = severe, H = high, M = moderate) are based on the percentage of contamination samples: <25% is moderate, 25% to 50% is high, 50% to 75% is severe and >75% is extreme.
Join 26,000+ subscribers
Subscribe to our newsletter to stay updated about all the need-to-know content in the feed sector, three times a week.


 Beheer
 WP Admin
  Bewerk bericht