Global view on feed cost and feed efficiency on dairy farms
The recent leap in grain prices has become higher than the 2008 level, which has a major effect on the whole dairy chain due to the competitiveness on feed resources and feed costs. However, to understand the drivers for feed cost, it is essential to benchmark the existing feeding systems. In a study by IFCN, feed efficiency and feed costs were used to analyse the cost of milk production and to show the role of feed costs and feed efficiency in milk production costs.
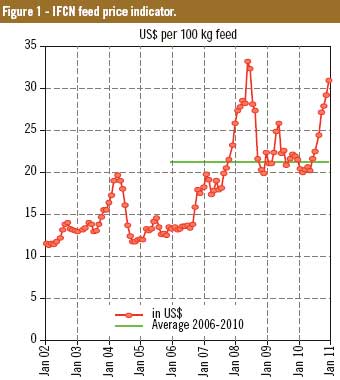
Feed prices have become extremely volatile in recent years. Soybeans and corn were used to describe trends in global feed prices. The calculated IFCN feed price indicator is based on 70% corn (energy feed) and 30% soybean meal (protein feed). This price indicator shows that from 2002 to 2006 average feed price was around US$15/100 kg feed while increasing strongly with large fluctuations ranging from $20 – $32/100 kg feed during the period from 2006 -2011 with average feed price of $21/100 kg feed in the same period. At the end of 2010 and beginning of 2011 the price increased up to $31/100 kg feed (Figure 1). The question is now, up to which level feed costs will increase under the huge increase in feed prices?
Comparative calculation method
The methodology applied for data collection, economic analysis and results validation was developed by the International Farm Comparison Network (IFCN) and uses TIPI-CAL (Technology Impact Policy Impact CALculation model). Complete typical dairy farms data were collected via research partners from different countries worldwide. In this study, a typical farm represents the most common farm type within a production system which produces the largest proportion of milk in a country or a region. Typical farms were built and validated by a panel of dairy experts. Farm data were inserted to the model which has a sub module (feed module). This feed module is combining both physical and economic aspects of feeding systems globally. The model analyses FE, intake data, feed economics, feed prices, nutrients use efficiency and land productivity on dairy farms. The results of this study represent average typical dairy farms in different countries in 2009.
Cost of milk production
In economic terms, cost of milk production is the most important indicator that determines profitability on dairy farms. Cost of milk production calculated as the total cost from the profit and loss analysis related to the total returns of the dairy enterprise including milk and non-milk returns (cost of milk production = the total cost from profit and loss account – non milk returns + opportunity cost + quota cost).
The results (Figure 2) show that two groups of regions can be identified: low cost regions (Africa, CEEC, South America, Asia and Oceania) and high cost regions (Western Europe, North America and the Middle East). Low cost regions have a cost level of about $30/100 kg, except Africa which has a much lower cost ($11/100 kg). For the high cost regions, Western Europe has the highest costs ($56/100 kg), while North America and the Middle East both have a cost level of $44/100 kg ECM (Energy Corrected Milk). It is interesting to note that there were farms in the high cost regions which were able to produce milk with costs of about $30-34/100 kg milk.
Share of feed cost on total costs
Feed costs usually have the biggest share in the cost of milk production; therefore digging deeper in feed cost analysis can improve on farm profitability. Feed costs ($/100 kg ECM milk) were calculated using the Activity Based Costing method where variable costs for feed production and the purchased feed, labour, land used for feed production and other on-farm inputs related to feed, were allocated to feed costs with grades from zero (i.e. no machinery used in feeding process) to 100% (i.e. purchased concentrate). These costs were then divided by the total cost of milk production to get the share of feed costs in percentage.
Based on the results from the average farms analysed, we cluster feed costs to three categories, high, average and low share of feed costs on total costs. The high share of feed costs is dominant in farms located in East Asia, parts of Latin America and in the Middle East where the share is usually higher than 70% of total milk production cost. This could be attributed to the high amounts of roughage and concentrates purchased, while other costs like labour and machinery are very small and don’t play a major role. Moderate share of feed cost, where at least 50-70% of total costs is going to feed, is found in the majority of farms in Central and South America, Africa, Oceania and southern parts of Europe. The moderate share of feed cost could be related to lower purchased feeds share and higher proportion of feed produced on-farm with lower production cost. Where other inputs such as labour and machinery represent a higher portion of the cost of milk production feed costs are less dominant in total milk production costs. With 40-50% of total milk production costs, this is dominant in farms located in north Asia, Europe and North America. The share feed costs in this system is the lowest as it could be related to higher input prices such as labour, large capital investments and quota costs, while higher costs are dedicated for feeding and manure handling.
The result of this study shows that higher feed costs do not mean higher animal performance and consequently feed efficiency; but feed cost is linked strongly to feed prices and the feeding system on farm.
Feed efficiency and milk yield
Feed efficiency (FE) recently has been integrated and used on dairy farms as an economic and performance indicator. With higher feed prices and costs it would be very important to have a short overview on FE as this indicator on dairy farms represents the ability of the cow to convert feed resources to milk. This indicator is used as a performance and an economic indicator to benchmark dairy farms. Feed efficiency is calculated as the ECM output per kg dry matter intake. The dry matter intake represents the average typical daily cow intake of the ration from lactating cows. To understand the relationship between feed efficiency and milk yield a regression analysis between these two variables was carried out (Figure 4).
The wide variation in feed efficiency shown in the regression line is attributed to the differences in the quality of the feedstuff fed to the animals and the dairy breeds used in addition to other factors such as lactation period and parity. One major driver of milk yield is the feed efficiency. The regression line shows the relation between Feed Efficiency and milk yield which elucidates a strong positive relation between both variables (R2 = 0.65). The slope shows that an increase of FE of one unit (0.1) will lead to an increase in annual milk yield of 750 kg ECM milk on global level. However, with higher feed efficiency animals are producing more milk, but under which cost? To answer this question, two average farms were compared in terms of feed efficiency, feed cost, share of feed cost and cost of milk production (Table 1). We note that in high yielding farms, animals characterised with higher feed efficiency and higher feed cost have a higher total cost of milk production as well. This shows that feed efficiency is a major driver for increasing milk yield but it is also a driver for cost of milk production. However, small scale dairy farms in Asian countries are characterised by lower feed cost due to the lower feed quality offered to cows from pasture or agricultural by-products. They produce less milk compared to the European farms which are characterised by higher feed quality and consequently higher feed efficiency and milk yield.
Conclusion
Milk and feed prices are presently the most volatile agricultural commodities in the world. Therefore any use of grains in animal feeding should be used efficiently, not only because it affects on farm profitability; but also because inefficient use of feed resources is environmentally pollutant. Via great variation in feed cost and feed efficiency between dairy farms, we understand that there are countries in which milk yield is very low but they produce milk at a lower cost. This draws a question on the future competitive advantage of such systems compared to high input-output systems.
Absolute feed costs are highest in the European countries where feed efficiency is also high, while the feed cost share in total costs is highest in developing countries, which reflect the production systems dominant in different countries. There is strong relationship between milk yield and feed efficiency worldwide. The African and south east Asian dairy farms can produce a low quantity of milk with low feed efficiency and low feed cost compared to the European farms. This implies that improving feed efficiency under the current feed price scenarios would remain a substantial way to reduce feed cost in countries where cost of milk production is high.
Join 26,000+ subscribers
Subscribe to our newsletter to stay updated about all the need-to-know content in the feed sector, three times a week.