Analysis of world milk production, prices and feeding
The International Farm Comparison Network (IFCN) is a global network of dairy researchers from over 90 countries and 103 dairy related companies. The network is focusing on analysing global dairy trends and milk production costs. Managing director Torsten Hemme shares his findings and opinions.
By Kaori Nishide
Dr Hemme you founded the IFCN – what is it?
The IFCN has developed out of my PHD thesis which I finalised in 1999. IFCN is a global network of dairy researchers to create a better understanding of milk production and related topics like milk prices.
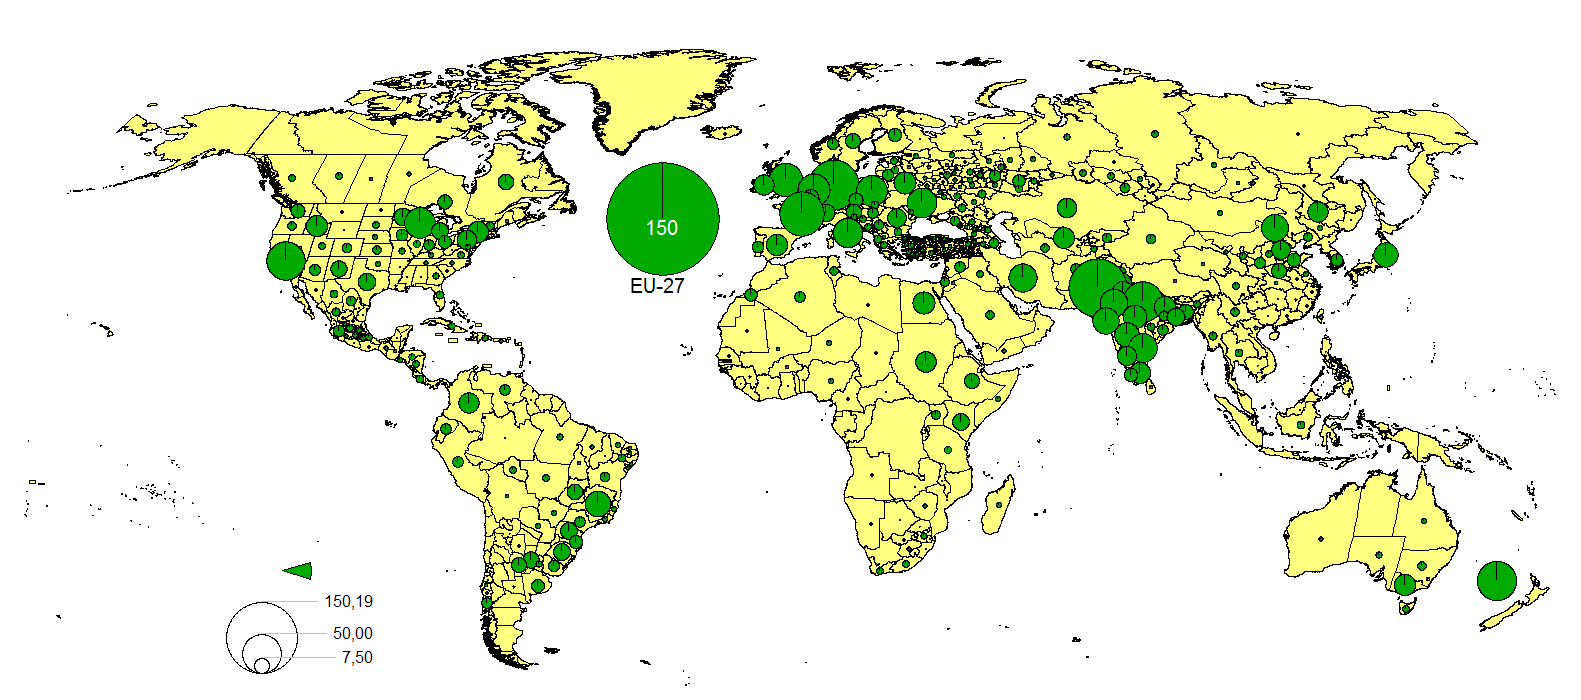
Can you give us an overview on world milk production at the moment?
It is very important not talk about countries but dairy regions. Based on the map above you see very quickly that Europe and South Asia are really the two main global dairy regions. It is also interesting to note that we have over 120 million dairy farms with an average farm size ca. 3 cows or buffalos per farm. Of course building averages is an oversimplification.
There are a wide range of dairy farms in the world keeping less than 3 cows per farm on the one side and on the other side in some countries, dairy farms are much bigger and keep over 1000 cows per farm.
What about milk price developments?
The IFCN has developed a milk price indicator which converts the dairy commodity prices of the world markets into a hypothetical price per kg milk. Before 2007 we had a level on the world market US$20 now this has moved to a level of ca. US$40. The volatile is huge +/- 20 around the mean. In July were on a level of US$50 or 38 euro/100 kg milk.
Does the world milk market price really matter for dairy farmers?
Yes we observe that with a delay of 1-6 month the world market prices very rapidly affects the national milk prices in almost every country. Actually this world price is much more important than the supply and demand balance within the country. Since January 2013 we have been publishing the world milk price monthly for everybody to see on our website www.ifcndairy.org.
What is your opinion on the farm margins concerning the feed price in relation to the milk price?
In theFigure 2 you find the world milk price and the related world feed price which we are estimating out of the corn and soya bean meal price to have an energy/protein balance feed. Both prices fluctuated +/- 50% around the mean in the period 2006 – 2013.
Besides this IFCN has developed a new farm economic indicator. This is the margin over compound feed costs. This indicator assumes an average feed intensity of 300g compound feed per 1 kg milk. This feed intensity could represent a farm with a milk yield of 8000 kg milk / cow and year using 2.4t of compound feed per year.
The margin over compound feed indictes clearly the critical farm economic situation in 2009 and also 2012. Moreover it illustrates that right now rising milk prices and falling feed prices are increasing the farmers margins to a level like it was in the succesful year 2007. So farm economics will be much better this year than last year.
How are different dairy farming systems affected?
It depends on the farm size, milk yield and related to that the feeding system. Together with IDF and FAO IFCN has been involved in project called “World mapping of animal feeding systems in the dairy sector”. First results have already been presented in 2011 at the IDF world dairy summit and we expect the final report to be ready in early 2014. We have contributed with IFCN data to represent dairy farming systems in 44 countries and 47 dairy regions.
Every farm has more or less its own feeding system how has IFCN analysed dairy feeding systems?
The IFCN methodology applied for data collection, economic analysis and results validation is done using three elements:
A) A network approach of research co-operating continuously,
B) The concept of typical farms described below and
C) A standard model TIPI-CAL (Technology Impact Policy Impact CALculation model) to insure technical comparability of indicators.
A typical farm represents the most common production system which produces a significant proportion of milk in a country or a region. Usually, two farm types are used per dairy region, the first represents an average farm and the second a larger. The typical farms were built and validated by a combination of accounting statistics and a panel of dairy experts. The data collection and validation were done by researchers in the represented countries, researchers in the IFCN Dairy Research Center and also during our annual IFCN Dairy Conferences.
Is this producing globally comparable results then?
Yes – this is the key benefit of this approach. To represent a country or a region we have started to use a typical average farm size per country. In the Figure 3 you can see how the feed ration looks for lactating dairy animals. The letters at the beginning of each farm type represents the country and the number the number of cows or buffalos per farm.
What will the dairy world look like in 10 years?
We need a lot of more milk as milk demand grows at ca. 20 million tons per year which is almost equal to the annual milk production in New Zealand. This milk will be produced in farming systems which have to be competitive and also resilient. The fitting feeding system and the feed intensity is key for a successful dairy farming system. To develop those farming and feeding systems is the real challenge for each dairy region and all stake holders in the dairy chain. We at IFCN are very happy to help local think tanks to develop such systems which will look quite different from region to region.
The major findings of the IFCN analysis.
Strong diversity in farming systems: Dairy feeding systems are very diverse in terms of 1) farm size, which varied between 2 cows in Bangladesh and 2218 cows in USA and 2) the feed items used. Even within a country, every farm has its own specific system. This analysis is a simplification of a very complex reality.
Milk yield globally ranges from 650 – 11 000 kg / cow per year: Milk yield on the typical average sized farms studied varied between low milk yields on the Cameroonian farm of 650 kg/cow per year, up to more than 11 000 kg/cow per year on the US farm (Sample average = 5900 kg/cow per year).
Forage dominates over concentrates in most feeding systems: The basic component of forage was grass and maize feeds. The share of forage in the diet on all farms was 69%, where the major feeds were maize silage, grass and grass silage.
Grass is the main feed base to produce milk in the world: Grass was found in almost all diets and was dominant on European farms, and on African, Latin American and New Zealand farms. The intake of grass varied between 10 % on the Jordanian farm up to 90% on the New Zealand farm. (Sample average 45%).
Concentrate is the second most important feed and represents 30% of the diets: Concentrate intake ranged between zero intake on the New Zealand farm up to 75% on feedlot farms in Jordan (Sample average 30%).
High share of concentrate feeds is usually processed: Processed concentrate feeds represented about 74% of concentrate intake on average, meanwhile a high share of home grown and non-processed concentrate (> 75%) was found in 6 countries.
Maize silage composes part of the diet in 26 countries: Maize silage was most dominant in a large number of countries in the EU and North and Latin America (all farms sample average 14%). It ranged between 51% on the farm with the highest share and 0% on the African and Southeast Asian farms.
Feed efficiency is higher than one in 27 countries: Feed conversion efficiency of lactating cows was the highest (>1) on the EU and North American farms and ranged between 1.63 in the grain and silage based feeding systems in Europe and 0.43 in grass based feeding systems dominant in Africa (all farms sample average 1.1 kg ECM milk/kg DM feed).
Join 26,000+ subscribers
Subscribe to our newsletter to stay updated about all the need-to-know content in the feed sector, three times a week.