Supply chain challenges likely to encourage mycotoxins
Challenges facing the animal feed supply chain may cause rises in mycotoxin levels.
The rerouting of shipments in the Red Sea and record corn harvests in the US are extending transit and storage times. About 40% of Asia-Europe trade normally goes through the Red Sea area. With shipments being rerouted due to geopolitical attacks, extending shipping times can allow moulds to degrade the nutrients in ingredients and produce mycotoxins. Stockpiling crops for long periods may also challenge quality assurance efforts on the farm.
Dr Swamy Haladi, global technical commercial manager for Mycotoxin Risk Management at Selko, said extended exposure to humidity during storage could create favourable conditions for moulds to reproduce.
“Some estimates suggest that the rerouting of shipments may extend crop transit time by at least 25%. As shipping costs are soaring (5 times more) and transit times are extended, it is critical that crops be safeguarded and the integrity of animal feed ingredients preserved,” said Haladi.
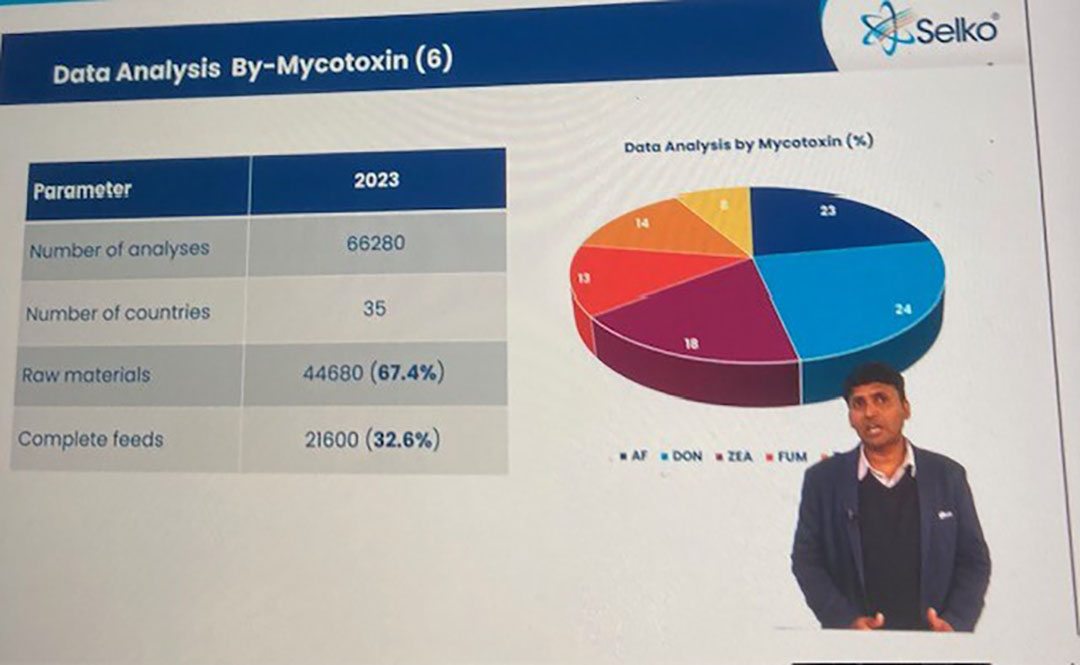
Speaking at the annual Selko mycotoxin review, Haladi said data inputted from across the globe meant that Selko was analysing around 1,250 analyses per week. In total in 2023, there were 66,280 observations from 35 countries, made up of 67% raw materials and 33% complete feeds. These samples included 21,601 feed samples, 16,923 grain samples, 12,383 grain by-products, 3,682 protein meals, 4,039 silage samples and 7,652 unspecific samples.
Most of the grain samples were maize (11,984) followed by wheat (2,754) and barley (1,611) with oats, sorghum, rice and millet making up the remaining samples. Of the feed samples, the major ones were pig feed (8,362), broiler feed (4,541), layer feed (4,086) and ruminant feed (2,640). Pet food, piglet feed and aquafeed were the other categories sampled.
Mycotoxin contamination domination
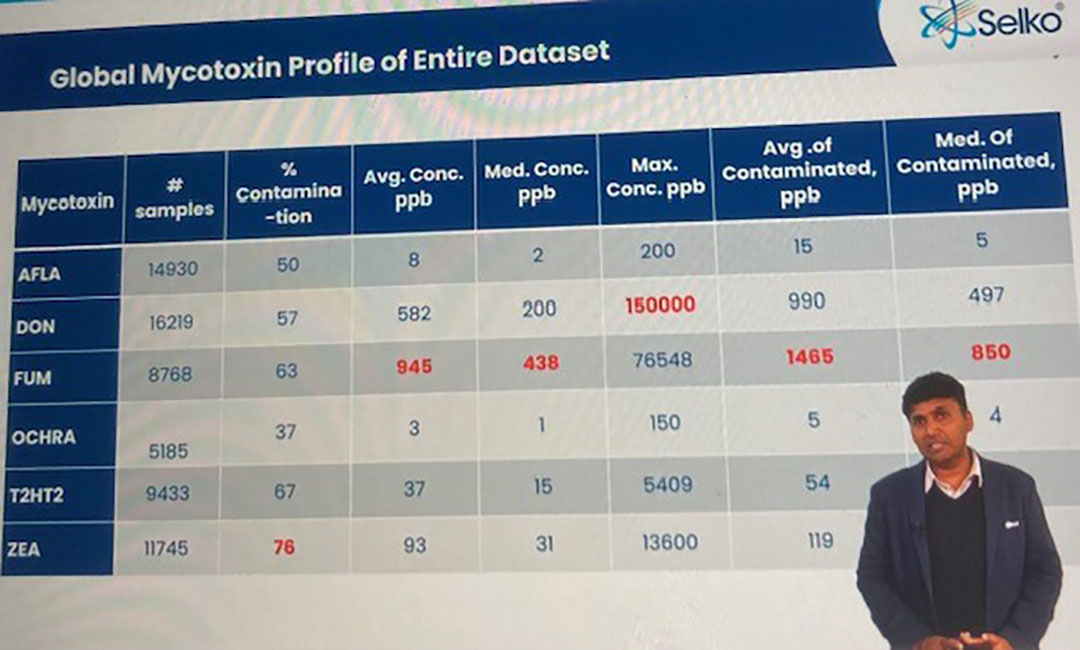
Haladi said based on the entire dataset the largest percentage of contamination was through Zearalenone (ZEA) at 78%, which was surprising as traditionally other mycotoxins were more prevalent. Attributing this to climate change, Haladi said the prevalence of other mycotoxins in samples included T2HT2 (67%), fumonisins (FUM) (63%), deoxynivalenol (DON) 57% and aflatoxins (AFLA) (50%).
Concentrations parts per billion showed FUM the highest (945ppb) followed by DON (582ppb) for average concentrations and then ZEA (93ppb). The median concentrations showed FUM at 438ppb, followed by DON at 200ppb with ZEA well behind at 31ppb. DON had the maximum concentration at 150,000 ppb. The average of the contaminated ppb showed FUM at 1,465ppb and DON at 990ppb. Haladi said the difference between FUS and DON was closer than in previous years.
Raw materials
Commenting on the raw materials results, Haladi said high contamination levels had been seen across the board except for rice when looking at grain samples compared to barley, maize, oats, sorghum and wheat. Very high percentages of T2 contamination had been found in oats and barley with high contamination levels of FUM in maize but also now rising in wheat, too.
Looking at mycotoxin concentration trends in maize last year, concentrations of DON had risen in the second half of the year when temperatures were cooler, whereas FUM levels were at their height in the summer months.
High contamination percentages, particularly of ZEA, were found in grain byproducts, while up to 97% of silages tested positive for T2, 92% for ZEA, 88% for FUM and 86% for DON. Concentration levels were also high at around 600-700ppb and Haladi urged producers to keep an eye on silages and quality of production.
Feeds
Turning to poultry feeds, Haladi said there was not much variation between layer and broiler feed contamination but higher DON contamination in layer feeds.
Concentrations were quite high with FUMs leading the chart around 800-900ppm followed by DON. Haladi said recent research had found out what levels were toxic to poultry – for example, for broilers, less than 250ppb were safe and needed no action; 250-500ppb represented low risk; 500-1,000ppb medium, 1,000+ppb high risk. He said birds were sensitive to both FUM and DON and their impact on gut health is more than previously realised, which will be an increasing issue for the sector in the year to come.
High levels of contamination were found in pig feed but one striking anomaly – piglet feed showed relatively lower level of contamination. The bulk of the samples showed high concentrations of FUM, DON and ZEA.
For ruminant feed, contamination levels are around 74-75% for T2 and ZEA followed by DON (62%) and AFLA (51%). Mature animals could handle the toxins. Significantly high contamination levels for DON and AFLA were seen in ruminant feed for calves.
ZEA contamination levels were found to be very high (82%) in pet food but concentration levels of DON and FUM were far higher than the other mycotoxins. And in the aqua sector contamination levels in fish feed higher than shrimp feed due to better quality raw materials in shrimp feed.
Prediction model
Avinash Bhat, technical specialist for mycotoxin analysis at Masterlab, said it was important to preserve feed from stress to achieve safer feed. Contamination patterns were changing due to climate change, increasing temperature and changes in patterns in precipitation leading in turn to changes in fungal pathogenicity in plants.
The quality of the data is critical to the success of any modelling strategy, he said. The data should be clean, accurate, and representative of the target populations. The global mycotoxin data set from 2020-23 (total 272,096 data entries) was used for developing a forecasting model, which looked specifically at 60,184 AFLA contamination data entries that were used for developing a forecasting model for 4 regions.
Based on the past 4 years, Bhat predicted that levels of AFLA would be between 26.1ppb this month, rising to 29.8ppb in April before falling away slightly to 27.8ppb in June. Levels in other parts of the world including Africa and Middle East and Latin America would be pretty flat during the first half of 2024. Europe is not conducive for AFLA -so Bhat expected it to be 3ppb during the first 6 months of the year.
Join 26,000+ subscribers
Subscribe to our newsletter to stay updated about all the need-to-know content in the feed sector, three times a week.